


Ridgerunner7 wrote:JoeRE wrote:Great thread! I will try to restrain my inner nerd here, but its probably gonna show through loud and clear
I've looked at my kills, but there's not enough data there to see much for trends. Even hunters that kill piles of bucks on here only have a few dozen data points when it comes to kills. So I switched to looking at sightings in all my hunts...turns out the hundreds of data points for that still weren't enough to show much. So then I switched to looking at trail camera data. The cameras I used data from were set up in spots like I would hunt - thick cover, travel routes near bedding. So "how" deer move in all the data is actually pretty consistent its not like I am using cameras set up over corn piles or food plots there is a lot more variability with that I think. I built a spreadsheet where all I have to do is type in the date and time of a photo. I get moon and sun data from the link I posted above and weather data from: https://www.ncdc.noaa.gov/cdo-web/datatools/lcd. The weather data is from the nearest airport to my locations but its in 15 minute increments. I have hardly scratched the surface of the weather data...I want to look at relative humidity and all that. So far I have stuck mainly to barometric pressure, temp, wind speed, moon phase, moon position.
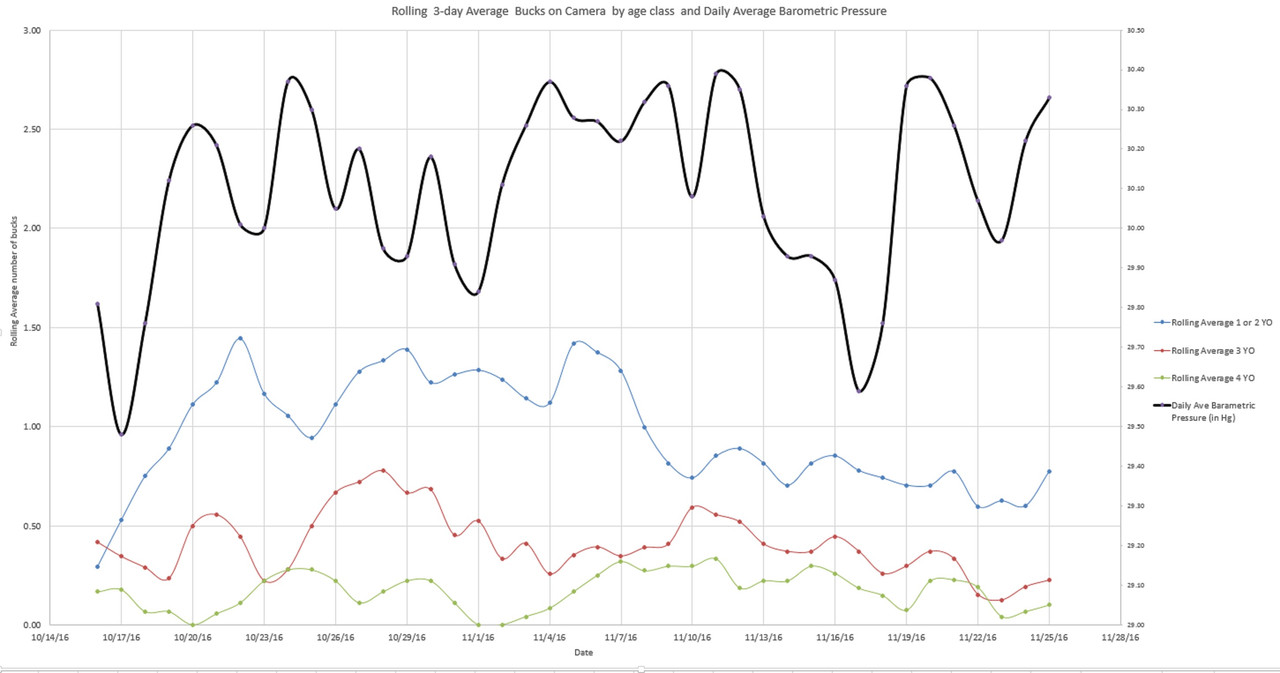
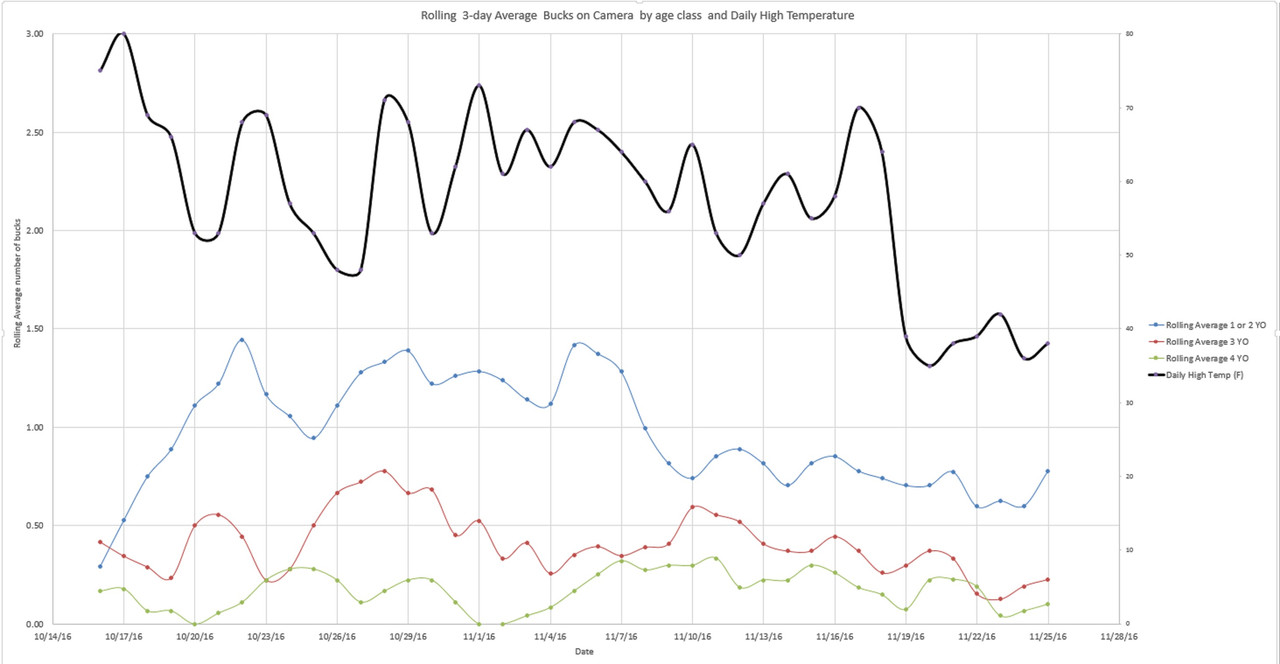
Anyway, a while ago I graphed DAYLIGHT trail camera observations from the 2014 and 2016 seasons and how the average number of deer I was getting changed through the fall. I think I posted this on here before but it probably was lost in the photobucket debacle.
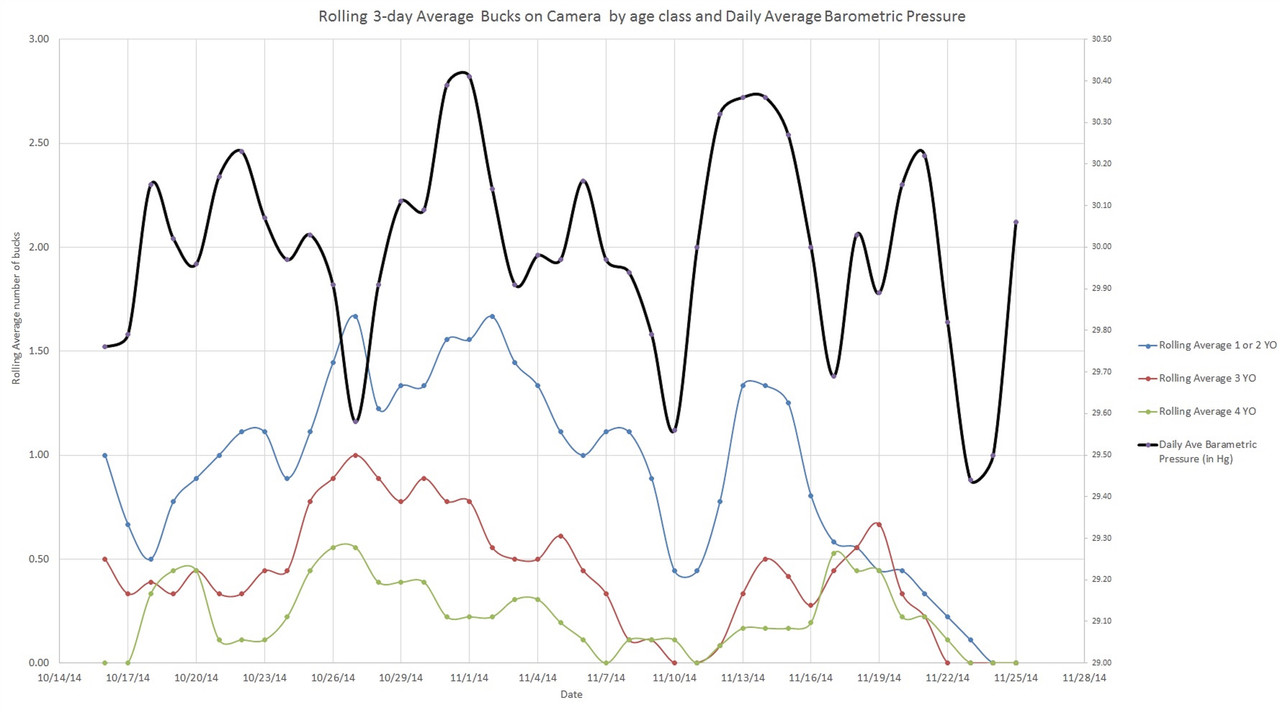
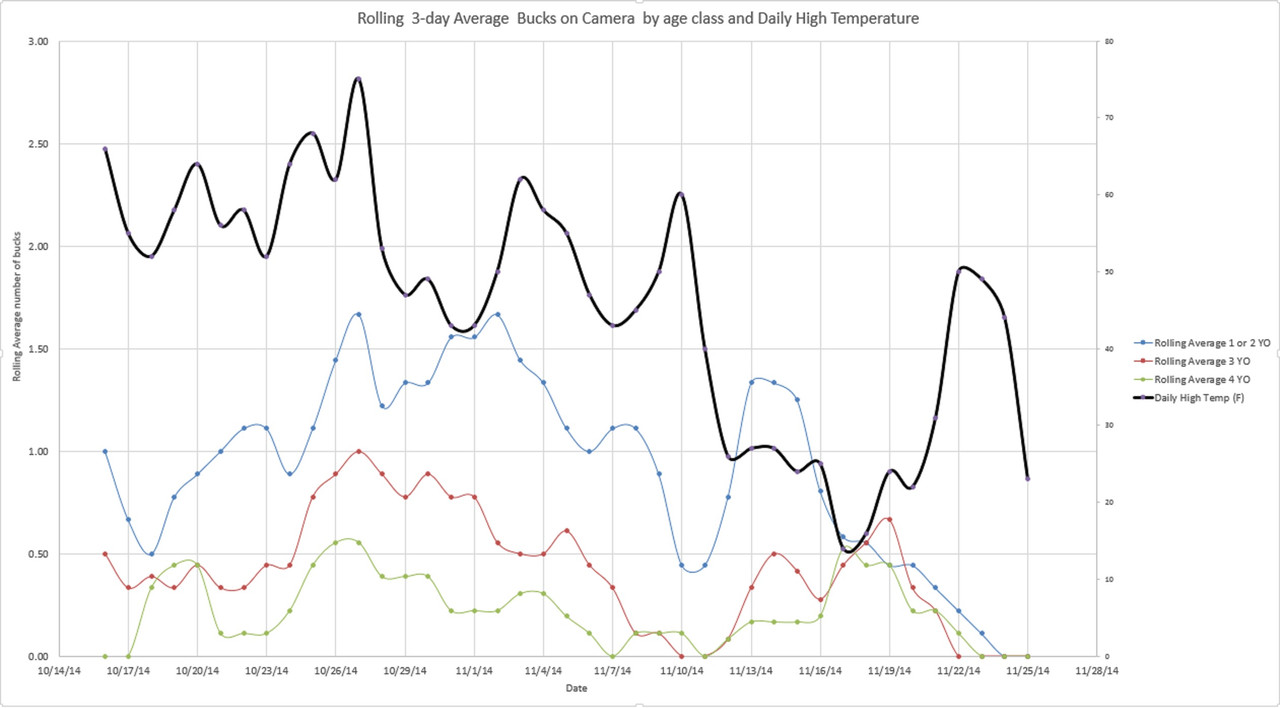
looking at these two, I am sure you are like yuck can't see anything there. Well, that's what I find fascinating. Compare that to the change in how many deer I was getting on my 6-8 cameras in 2014!
In 2014 you can see peak rut, a sharp drop off that coincided with lock down, then another good peak following lock down. I also noticed a lot of hunters said 2014 was a classic great rut. A lot of people complained about a trickle rut in 2016 and I think there were two reasons for this. The weather was more stagnant - less pressure and temperature changes. Meaning less/smaller cold fronts.
The Rutting moon was November 6th in 2014 and November 14 in 2016. I firmly when the rutting moon lines up generally with peak rut each phase of rut activity becomes a lot more clear - meaning the peak has more activity, followed by a hard lock down and a nice second peak of mostly older bucks looking for the first hot doe. If the full moon falls in the pre rut, I also see that phase having more activity but then the rut ends up being less than average daylight movement. Why I do not know - I am aware science says most does get bred the same time every year. HINT full moon is on October 22nd this year
I do agree with the 1 week window centered around a full moon that Maine mentioned earlier in this thread. The crazy thing is, I also think there is overall LESS deer movement at first and last light right around a full moon. But bigger bucks are on their feet more in daylight, particularly in the middle of the day. Full moons do have underfoot transits in the middle of the day, but to be honest the more I have looked for a correlation between overhead and underfoot moon position, the less I see. So I am back to undecided on that factor.
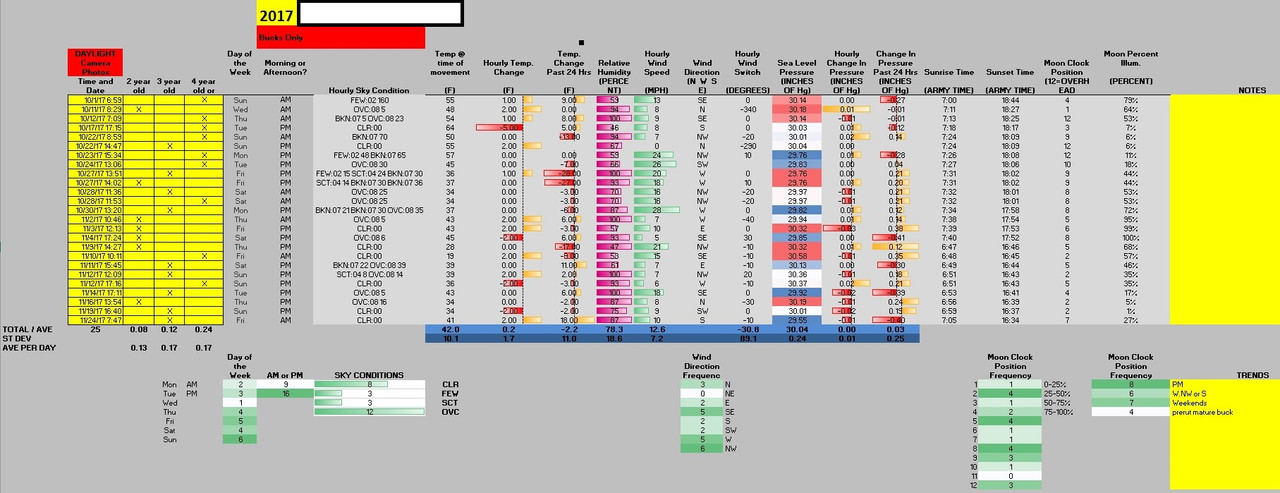
So regarding weather, here is an example of how I slice that data - I enter in what I saw by location and then sit back and see what the numbers look like. Yea it took quite a few hours to build the spreadsheet but its fast now - a few minutes to copy in the weather and moon data from each fall and a few minutes for each camera typing in date and time of every daylight picture I want to include.
I find all sorts of trends doing this. In this case, there clearly is more movement in the afternoon. Its a ditch crossing close to bedding so that makes sense as bucks are exiting the bedding. The bedding area is used by a mature buck most often in the prerut, probably because there is really good doe bedding close by and this spot allows them to keep tabs but still be concealed. Its also really hard to get to, and that is why I think it sees more activity on the weekends - pressure from surrounding areas causes bucks to shelter here unlikely to be disturbed. I have never had another hunter on this camera and its on public land.
Lastly, the bedding is on a point preferable for W/NW winds so as expected those are favored. I couldn't say for sure why quite a few bucks came through on SE winds, that would make this sidehill a windward spot, other than to say SE winds are very common. That is the next level that I need to get into. I will compare frequency of occurances against what proportion of time a certain condition actually existed. That's why the above table is nifty but actually doesn't show that much. Hypothetically say a NW wind blew 90% of the time you had a camera out. Of course most of trail cam pictures will show a NW wind but another wind might be more favorable,
I knew I could count on you Joe. Awesome data.
X2. I was waiting on Joe to see this and chime in. Awesome data man, tons of valuable information there!


